Authors
Nairit Barkataki*, Banty Tiru# and Utpal Sarma*
* Dept of Instrumentation & USIC, Gauhati University, Guwahati, India
# Dept of Physics, Gauhati University, Guwahati, India
Note:
This article was published in the Journal of Applied Geophysics You may cite the article using the following bibliographic data:
© 2022 Elsevier B.V.
Contents
1. Introduction
2. Materials and Methods
2.1. Hardware Platform for the GPR System
2.1.1. Experimental Setup
2.1.2. Validation of Hardware Platform
2.2. Materials
2.2.1. Case 1: Data in Time Domain
2.2.2. Case 2: Data in Frequency Spectrum
2.3. Proposed ANN architecture
2.3.1. Loss Function
2.3.2. Evaluation Metrics
2.3.3. Final Architecture
3. Results and Discussion
3.1. Testing on unseen data
3.1.1. Metallic targets
3.1.2. Non-metallic targets
4. Summary
5. Acknowledgements
6. Data Availability
1. Introduction
Ground Penetrating Radar (GPR) is a versatile and reliable tool that is used for detecting buried objects. Its major strengths include its low cost compared to traditional methods, and non-destructive nature. There are numerous applications of GPR, including estimation of soil, snow and ice properties [1][2][3], non-destructive inspection of archaeological sites [4], examining building condition [5], inspecting roads and tunnels [6], detecting landmines and other buried explosive devices [5], borehole inspection [7], study agriculture properties of soil [8], locating weak zones within embankments [9] etc.
A GPR survey often takes much lesser time than alternative technologies. When compared to other geophysical tools such as seismic, transient electromagnetic, electrical, and magnetic techniques, GPR gives data that has higher resolution and better accuracy [10].
Planning and conducting an effective GPR survey requires a lot of experience. The interpretation of GPR data is usually not intuitive and special skills are required to convert the measurements into clear images that can help in making critical decisions in various fields like civil engineering, archaeology, military etc.
In case of GPR-based concrete, bridge and road investigations, the most common applications appear to be the detection of pipes [11][12] and reinforcement bars [13], identifying defects in roads and bridges [14], and to determine the thickness of pavements [15].
One area where significant improvement has been realised is in the estimation of the size of buried targets. Several researchers have published their work on estimating rebar diameter [16][17][18]. However, the signal processing strategies proposed by them have proven to be complex and time intensive.
When the diameter of a pipe is smaller than the wavelength of the signal, estimating its diameter becomes challenging. In such cases, the arrival times of the echo signal cannot be co-related to the the diameter of the pipe [19]. This is typical in underground pipe detection, where the pipe diameter may be 50 mm and the wavelength of the transmitted pulse is 75 cm (for 400MHz centre frequency antenna). A variety of solutions have been proposed to overcome this drawback.
GPR does not directly measure the diameter of rebars, cables or pipes [20]. When used with targets having larger diameters, GPR can produce stronger radar wave reflections. However, depending on the wavelength of the signal, smaller objects may produce very low intensity reflections that may seem like a dot in the final B-Scan image. Rathod et al. (2019)[20] presented a study where they tried to estimate rebar spacing and diameters using GPR. They were able to estimate rebar spacing with errors ranging from 2-11%. However, the percentage errors in determining rebar diameter was beyond 100% in some cases.
In other studies, researchers have used a combination of GPR and an EM-based system to detect and estimate the size of rebars. Zhou et al. (2018)[21] developed a GPR-EMI dual sensor based system that simultaneously estimated rebar diameter and cover thickness. Barrile and Pucinotti (2005)[22] combined GPR with a different commercial EM-based system to detect rebars. They reported that they could estimate rebar diameter with a 12% error. This method, however, was time-consuming as data collection using the handheld concrete pachometer was slow. A linear relationship was found between the rebar diameter and maximum GPR amplitude by Hasan and Yazdani (2016)[23]. However, it is not possible to quantitatively relate the peak amplitude of the echo signal with the rebar diameter without knowing the amplitude of the source wavelet and concrete conditions.
The quality of GPR data is usually degraded by background clutter [24], noisy environments like roots and bricks [25], heterogeneous soils and mutual interactions of the waves [26].
Researchers have provided a variety of ways for analysing GPR data in recent years. Histograms of Oriented Gradients (HOG) based feature extraction method has been used effectively to identify landmines [27]. Fourier Transform and Principal Component Analysis have also been used to identify landmines [28]. Diameter estimation of underground pipelines and wires by fitting hyperbolas and localising hyperbola coordinates are widely used methods we well [29][30][31][19][26][32].
Other techniques begin with machine learning algorithms that extract hyperbolic features, followed by a fitting algorithm. Deep-learning-based interpretation algorithms have been the subject of extensive study in recent years [33][34][35].
Among the earliest proponents of using neural networks in GPR data interpretation, Costamagna et al. (1998)[36] used neural networks to search for object signatures from GPR data. They demonstrated that pipe signatures extracted using neural networks had the same degree of precision as human operators. To determine the position of buried items in GPR pictures, Singh and Nene (2013)[37] used a curve fitting technique along with neural network. The buried objects were localised with curve fitting technique. Their proposed approach could locate buried objects with a total reported accuracy of 91%. The adoption of the deep learning neural network idea for GPR underground utilities has demonstrated promising results [38][39][40].
Lei et al. (2019)[26] utilised a R-CNN to isolate potential hyperbolic regions from gray GPR B-scan images. The detected rectangular region was then converted to a binary image and hyperbolic signatures were identified using a double cluster seeking estimate algorithm. Their proposed scheme could automatically extract information related to buried objects with a precision of 96% on real GPR data. Lei et al. (2020)[41] proposed a scheme to estimate the diameters of buried objects. Their method involved an adaptive target region detection (ATRD) algorithm to isolate the hyperbolic signatures in B-Scans, followed by a CNN model for feature extraction and estimation of diameter. Their framework achieved an accuracy of 92.5% on field datasets.
The majority of research efforts have traditionally focused on the analysis of GPR signals within the time domain, although recent studies have increasingly focused on analysis in the frequency domain. Laurens et al. (2005)[42] analysed the relationship between the spectral content of signals reflected by concretes of various degrees of saturation, using a 1.5 GHz antenna system. They found a difference in the central frequency of the reflected signals when the spectrum for dry (1.4 GHz) and saturated (1.18 GHz) concrete were compared.
Studies by Rodés et al. (2015)[43] have shown that there is a distinct correlation between the spectrum of the recorded traces and the subsurface structures. Radar signals are scattered when targets are present in the medium. The amplitude of the wave, A(r) at a certain distance r from the source, can be represented as a function of the wave amplitude at the source and the losses caused by those attenuating effects:
\begin{equation} \label{eq1} A(r) = A_0\frac{1}{r}e^{-(\alpha+\mu)r} \end{equation} $A_0$ being the amplitude of reference at the source, r the distance, $\alpha$ the coefficient of attenuation due to the absorption and $\mu$ the coefficient of scattering. The coefficient of scattering depends on the number of scatterers per unit of volume, n and on the cross section of the scatterers, $C_S$. \begin{equation} \label{eq2} \mu = \frac{nC_s}{2} \end{equation}Moreover, the effect of scattering is frequency dependent, because the cross section depends on the frequency of the incident field [44].
Estimating the size of the target object is one area where considerable progress has been made. Several research groups have established experimental relationships between the amplitude and frequency content of the hyperbolic returns and the diameters of embedded bars, as well as additional properties of the rebar and concrete [45][46][47][48].
Bi et al. (2018)[49] analysed the spectral characteristics of target GPR signals and proposed a method to suppress random noise from GPR data. They used a singular value decomposition (SVD) method to filter out unwanted data and reconstruct the GPR data. They found that the proposed approach showed improved results in suppressing noise and clutter, compared with the conventional time-domain method.
According to the study presented by Che et al. (2021)[50], it was easier to detect the depth and position of buried objects when analysing the GPR data in frequency domain. Park et al. (2021)[51] applied frequency-wavenumber migration (f-k migration) using the Fast Fourier Transform (FFT) to the GPR data and used YOLO-v3 algorithm to detect rebars and estimate their diameters. Three rebars were used having diameters 10 mm, 20 mm and 30 mm. Their proposed model could estimate rebar diameters with an average accuracy of 98% and was found to be more accurate than other conventional methods. GPR data was also analysed in the frequency domain by Kang et al. (2022)[52] to detect and estimate the size of a cavity beneath a concrete plate.
However, there is still scope of improvement in the accuracy, speed, and other parameters of the models proposed by researchers. This study presents an novel artificial neural network (ANN) based model to estimate the diameter of buried rods (solid) and pipes (hollow). GPR data collected in the time domain domain is converted to frequency domain using FFT, after which the ANN-based estimator is used. Data is collected using a Field Programmable Gate Array (FPGA) based prototype GPR system.
2. Materials and Methods 2.1. Hardware Platform for the GPR SystemFPGA-based embedded systems provide a rapid prototyping platform, given the flexibility of these devices for intricate system designs, as well as low static and dynamic power consumption, high performance and a re-programmable medium to implement a variety of applications.
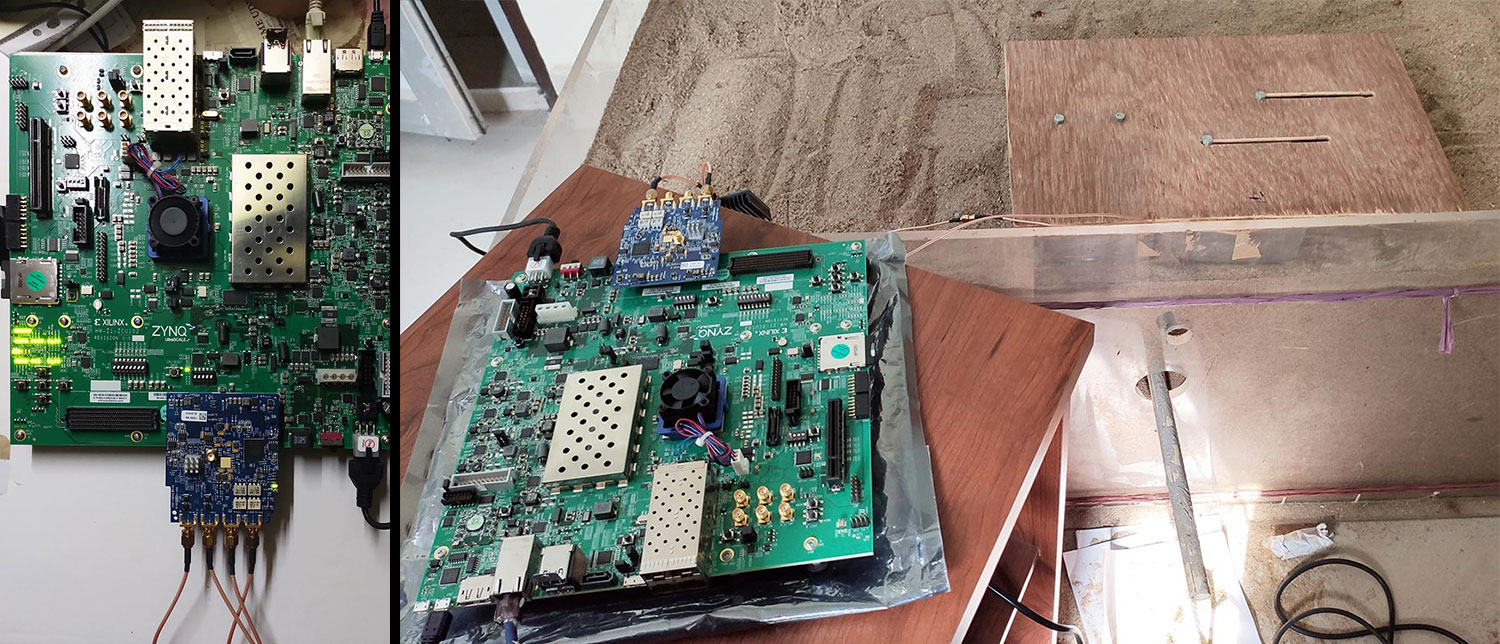
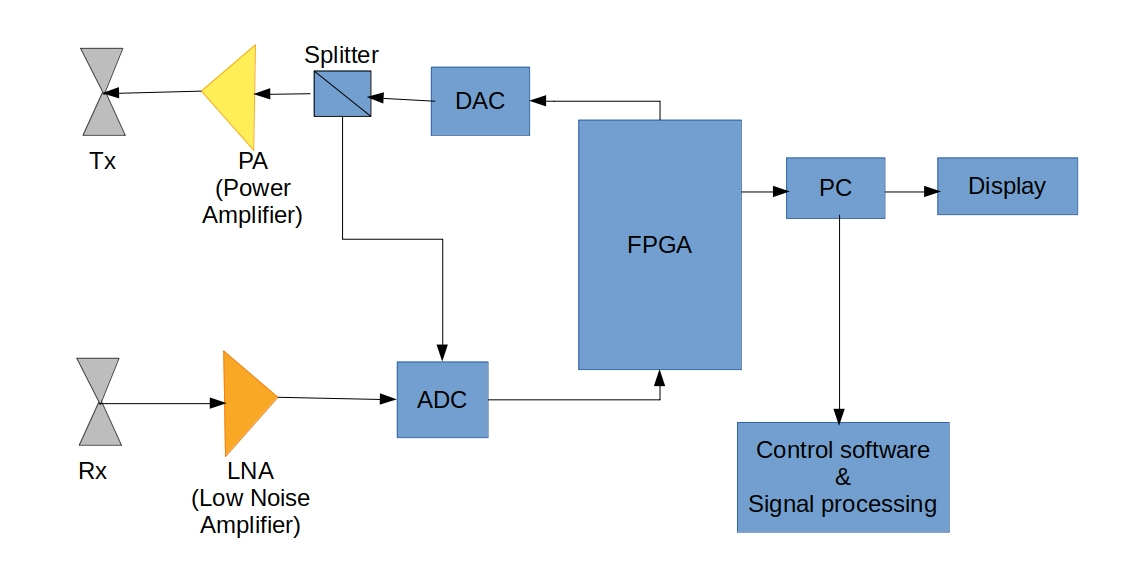
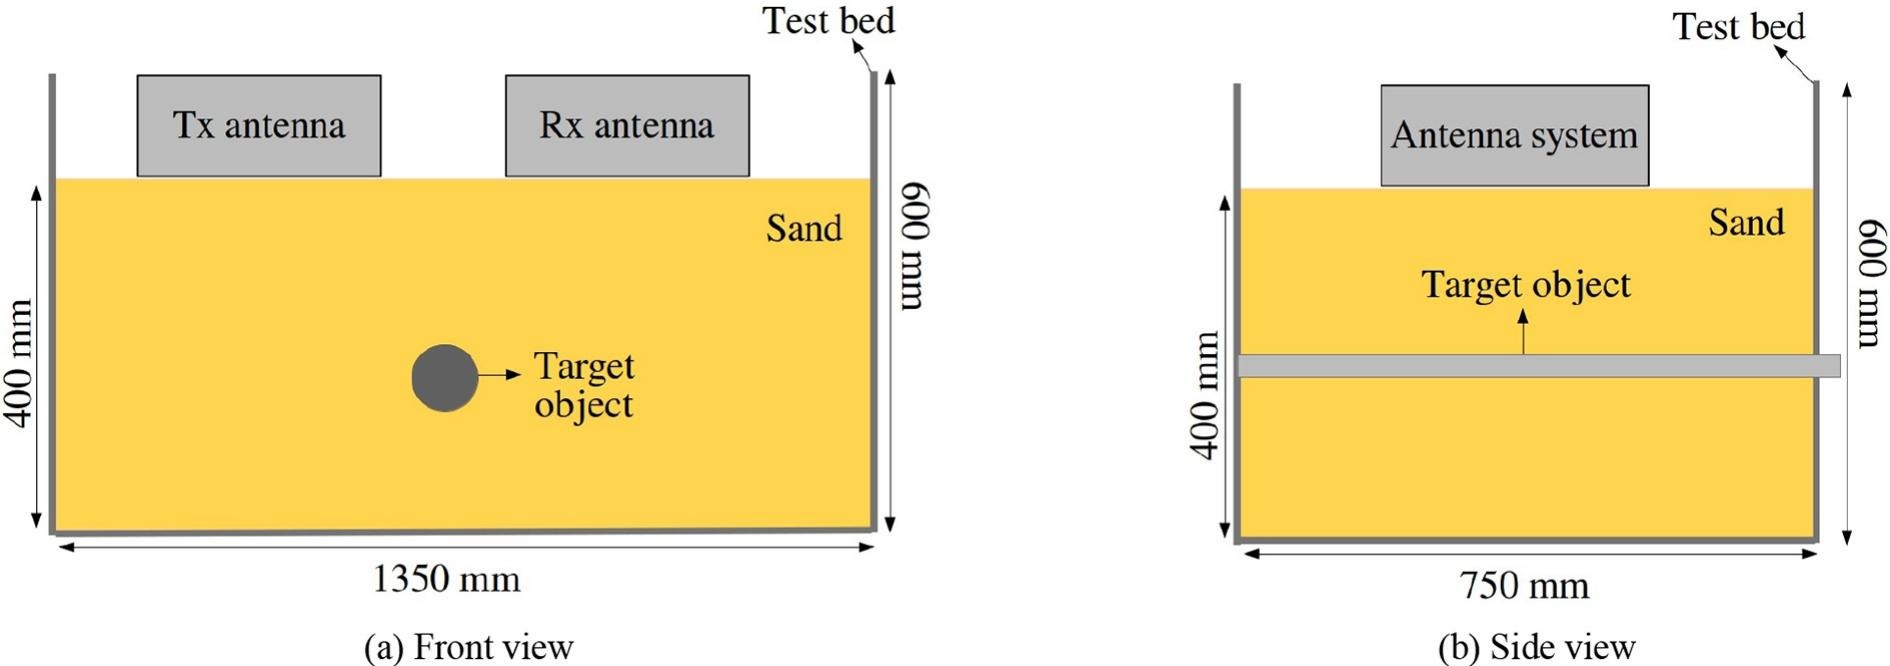
A hardware platform for the prototype GPR system has been developed which uses a Xilinx UltraScale+ MPSoC FPGA board as the base. A 14-bit, 1.0 GSPS ADC and a 16-bit, 2.8 GSPS DAC are interfaced to the FPGA board for both signal generation (transmission) and digitisation of the received signals. A ricker, gaussian or any custom waveform can be generated using the DAC. This signal (waveform) is then amplified using a power amplifier before feeding it to a transmitting antenna. Two custom designed 400 MHz coaxial-fed bow-tie antennas are used as transmitting and receiving antennas [53]. The received signal is first amplified using a low noise amplifier (LNA) before feeding the signal to the ADC. The digitised signal is then processed by the FPGA and various GPR signal processing algorithms are applied before a final image (A-Scan / B-Scan) can be formed. A block diagram of the hardware system is shown in Figure 2.

| Sl. No. | Target | Outer Diameter (mm) |
|---|---|---|
| 1 | Aluminium bar | 15 |
| 2 | Aluminium bar | 15 |
| 3 | Reinforcement bar | 10 |
| 4 | Reinforcement bar | 15 |
| 5 | Reinforcement bar | 15 |
| 6 | Reinforcement bar | 22 |
| 7 | Stainless steel pipe | 10 |
| 8 | Stainless steel pipe | 15 |
| 9 | Stainless steel pipe | 18 |
| 10 | Stainless steel pipe | 25 |
| 11 | Stainless steel pipe | 30 |
| 12 | Stainless steel pipe | 38 |
| 13 | Stainless steel pipe | 50 |
| 14 | PVC Pipe | 22 |
| 15 | PVC Pipe | 29 |
| 16 | PVC Pipe | 29 |
| 17 | PVC Pipe | 35 |
| 18 | PVC Pipe | 41 |
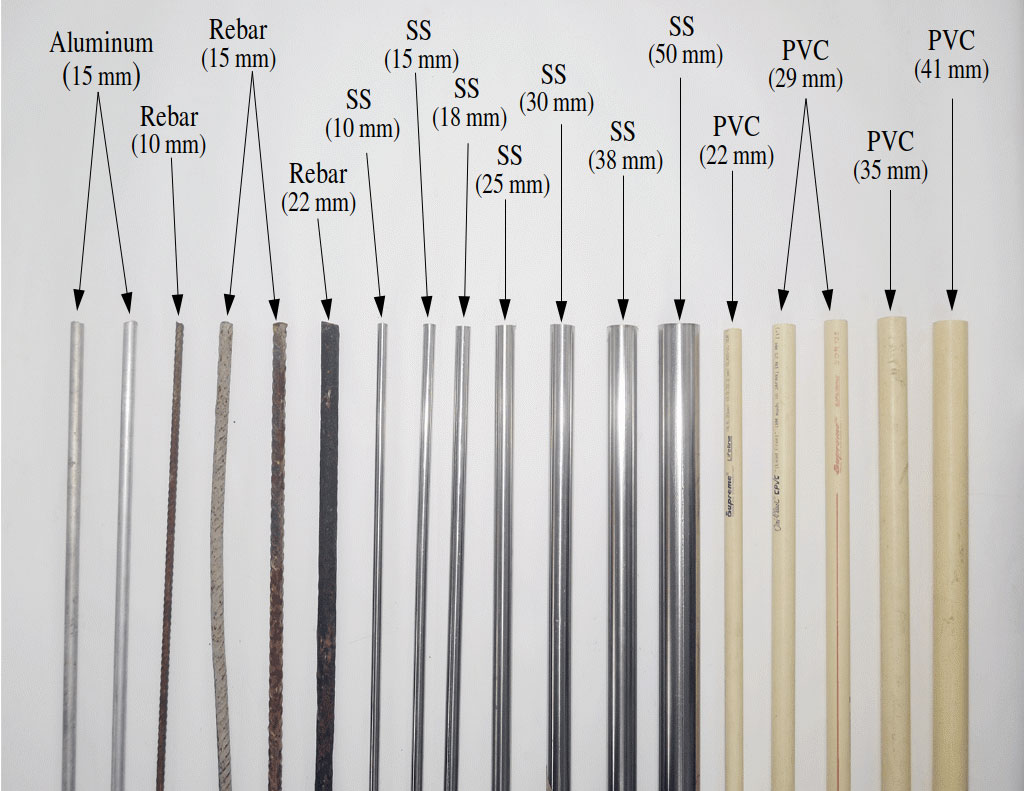
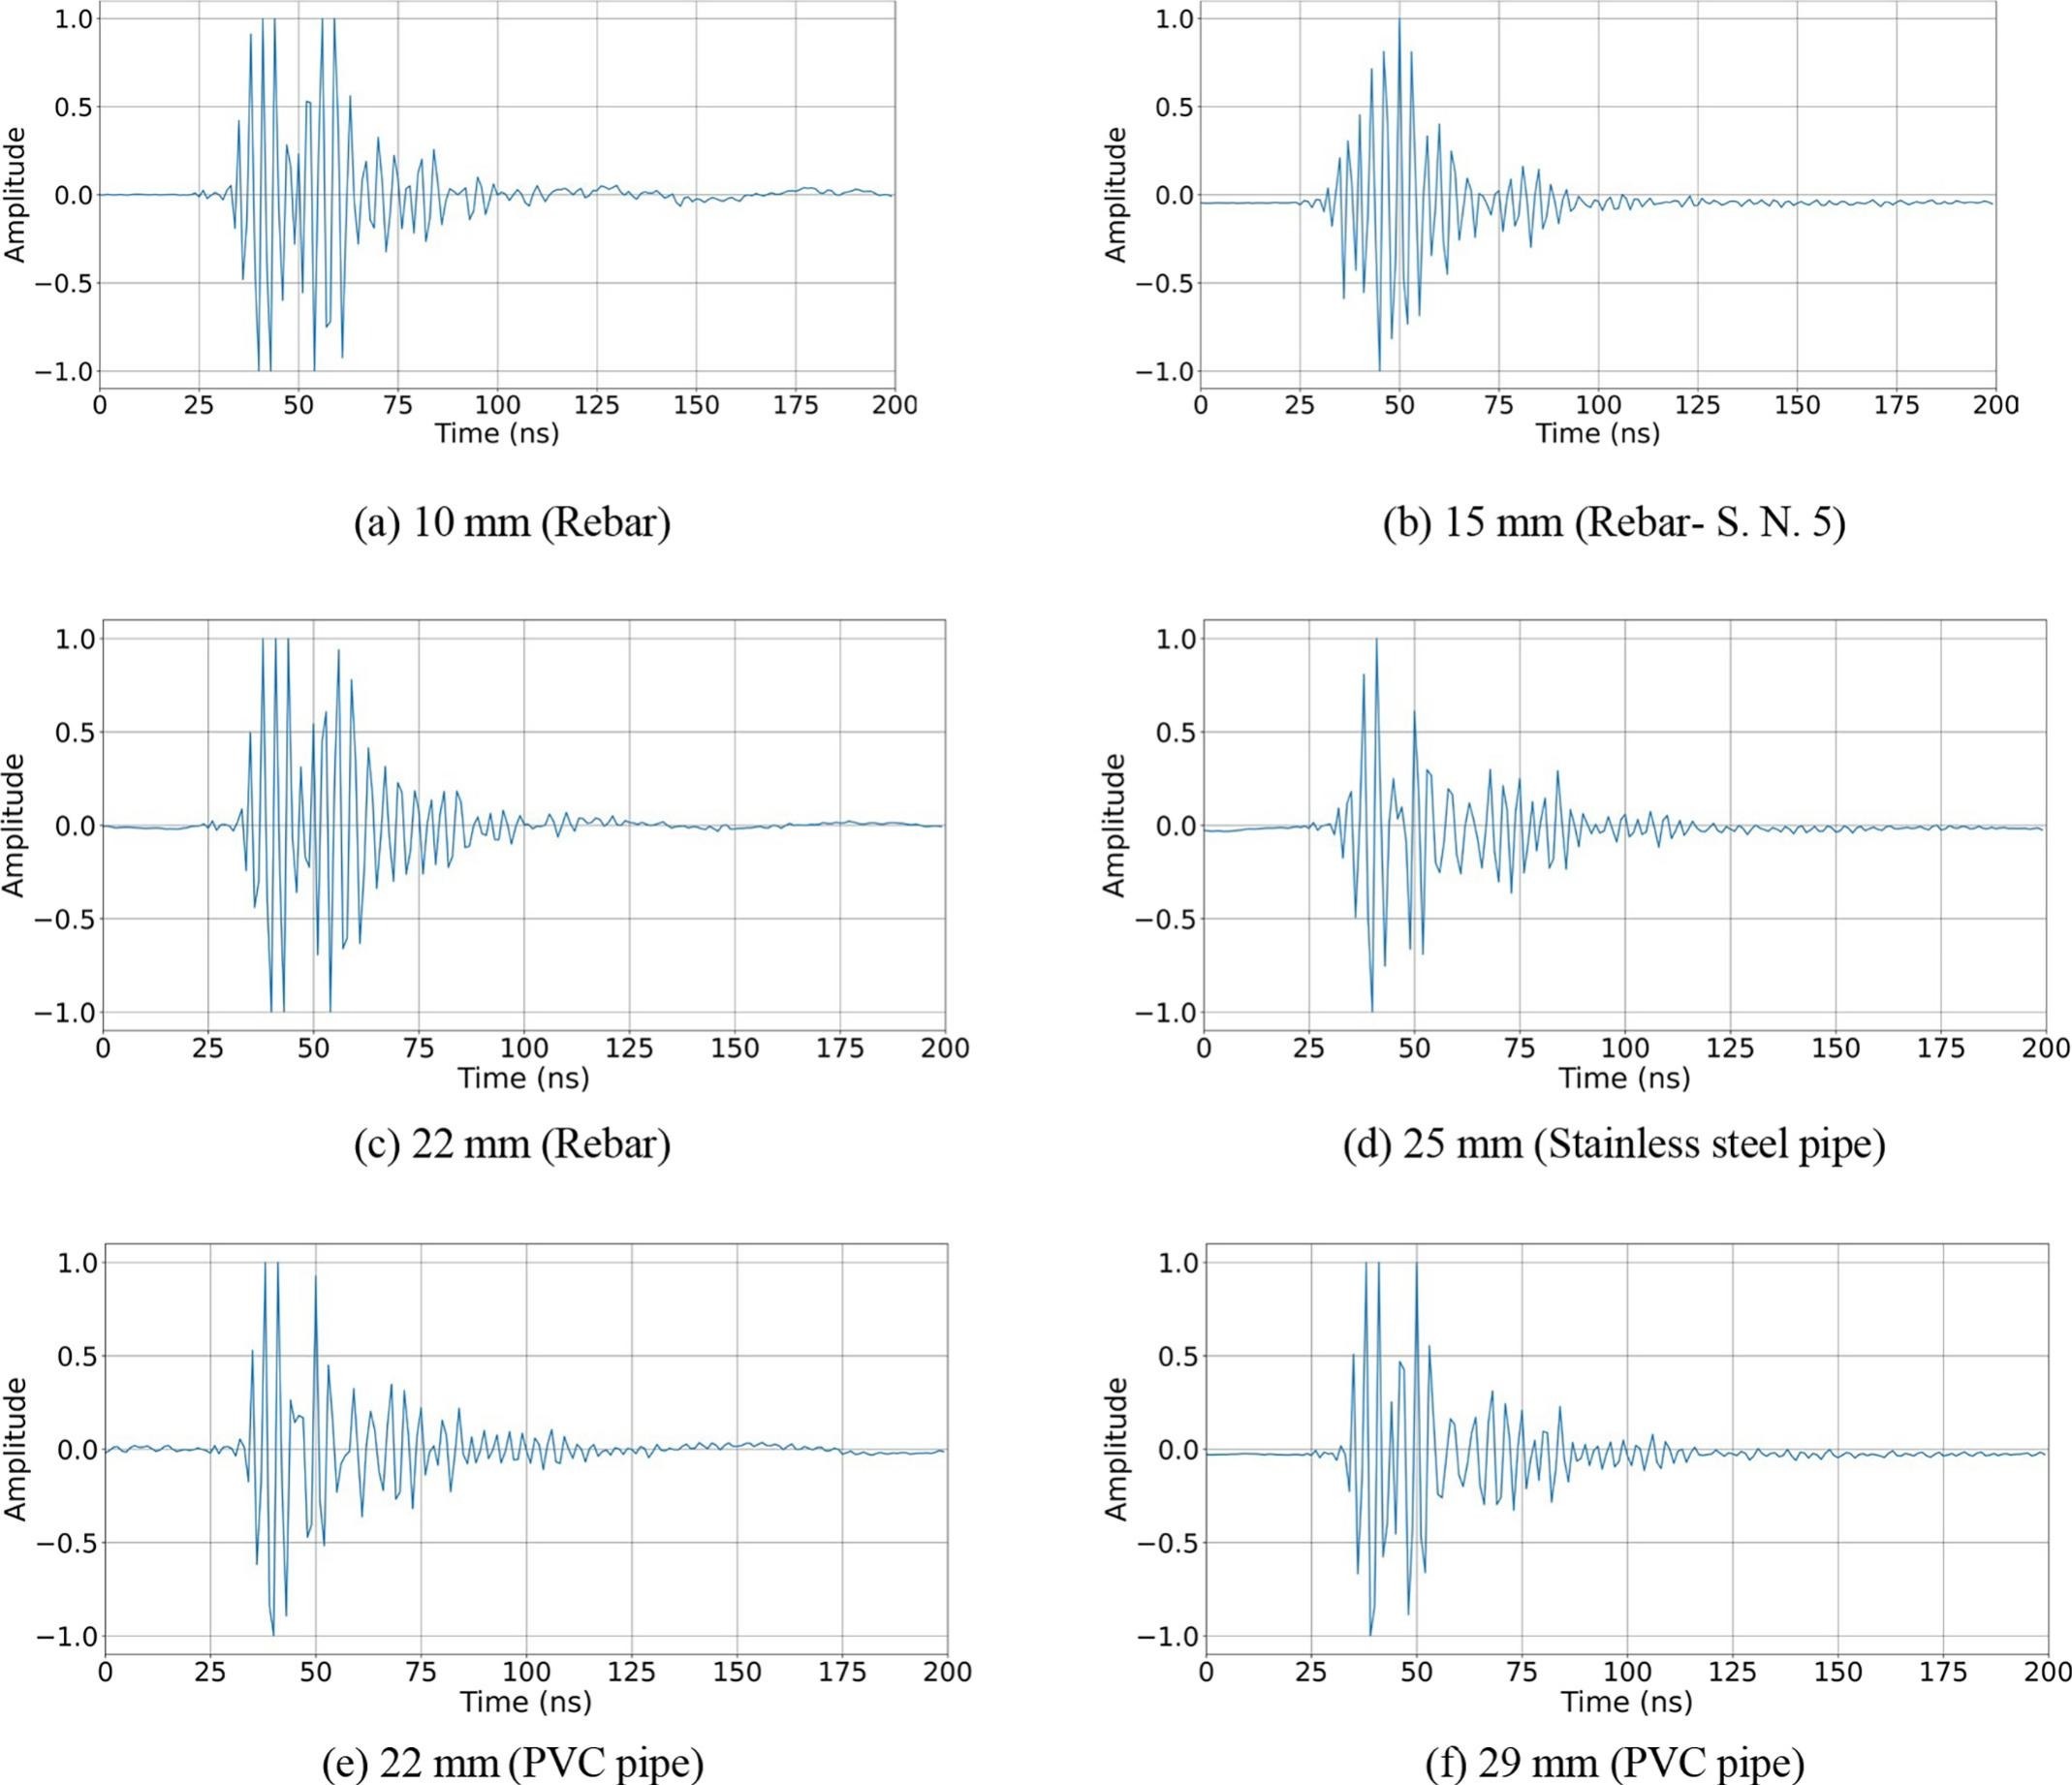
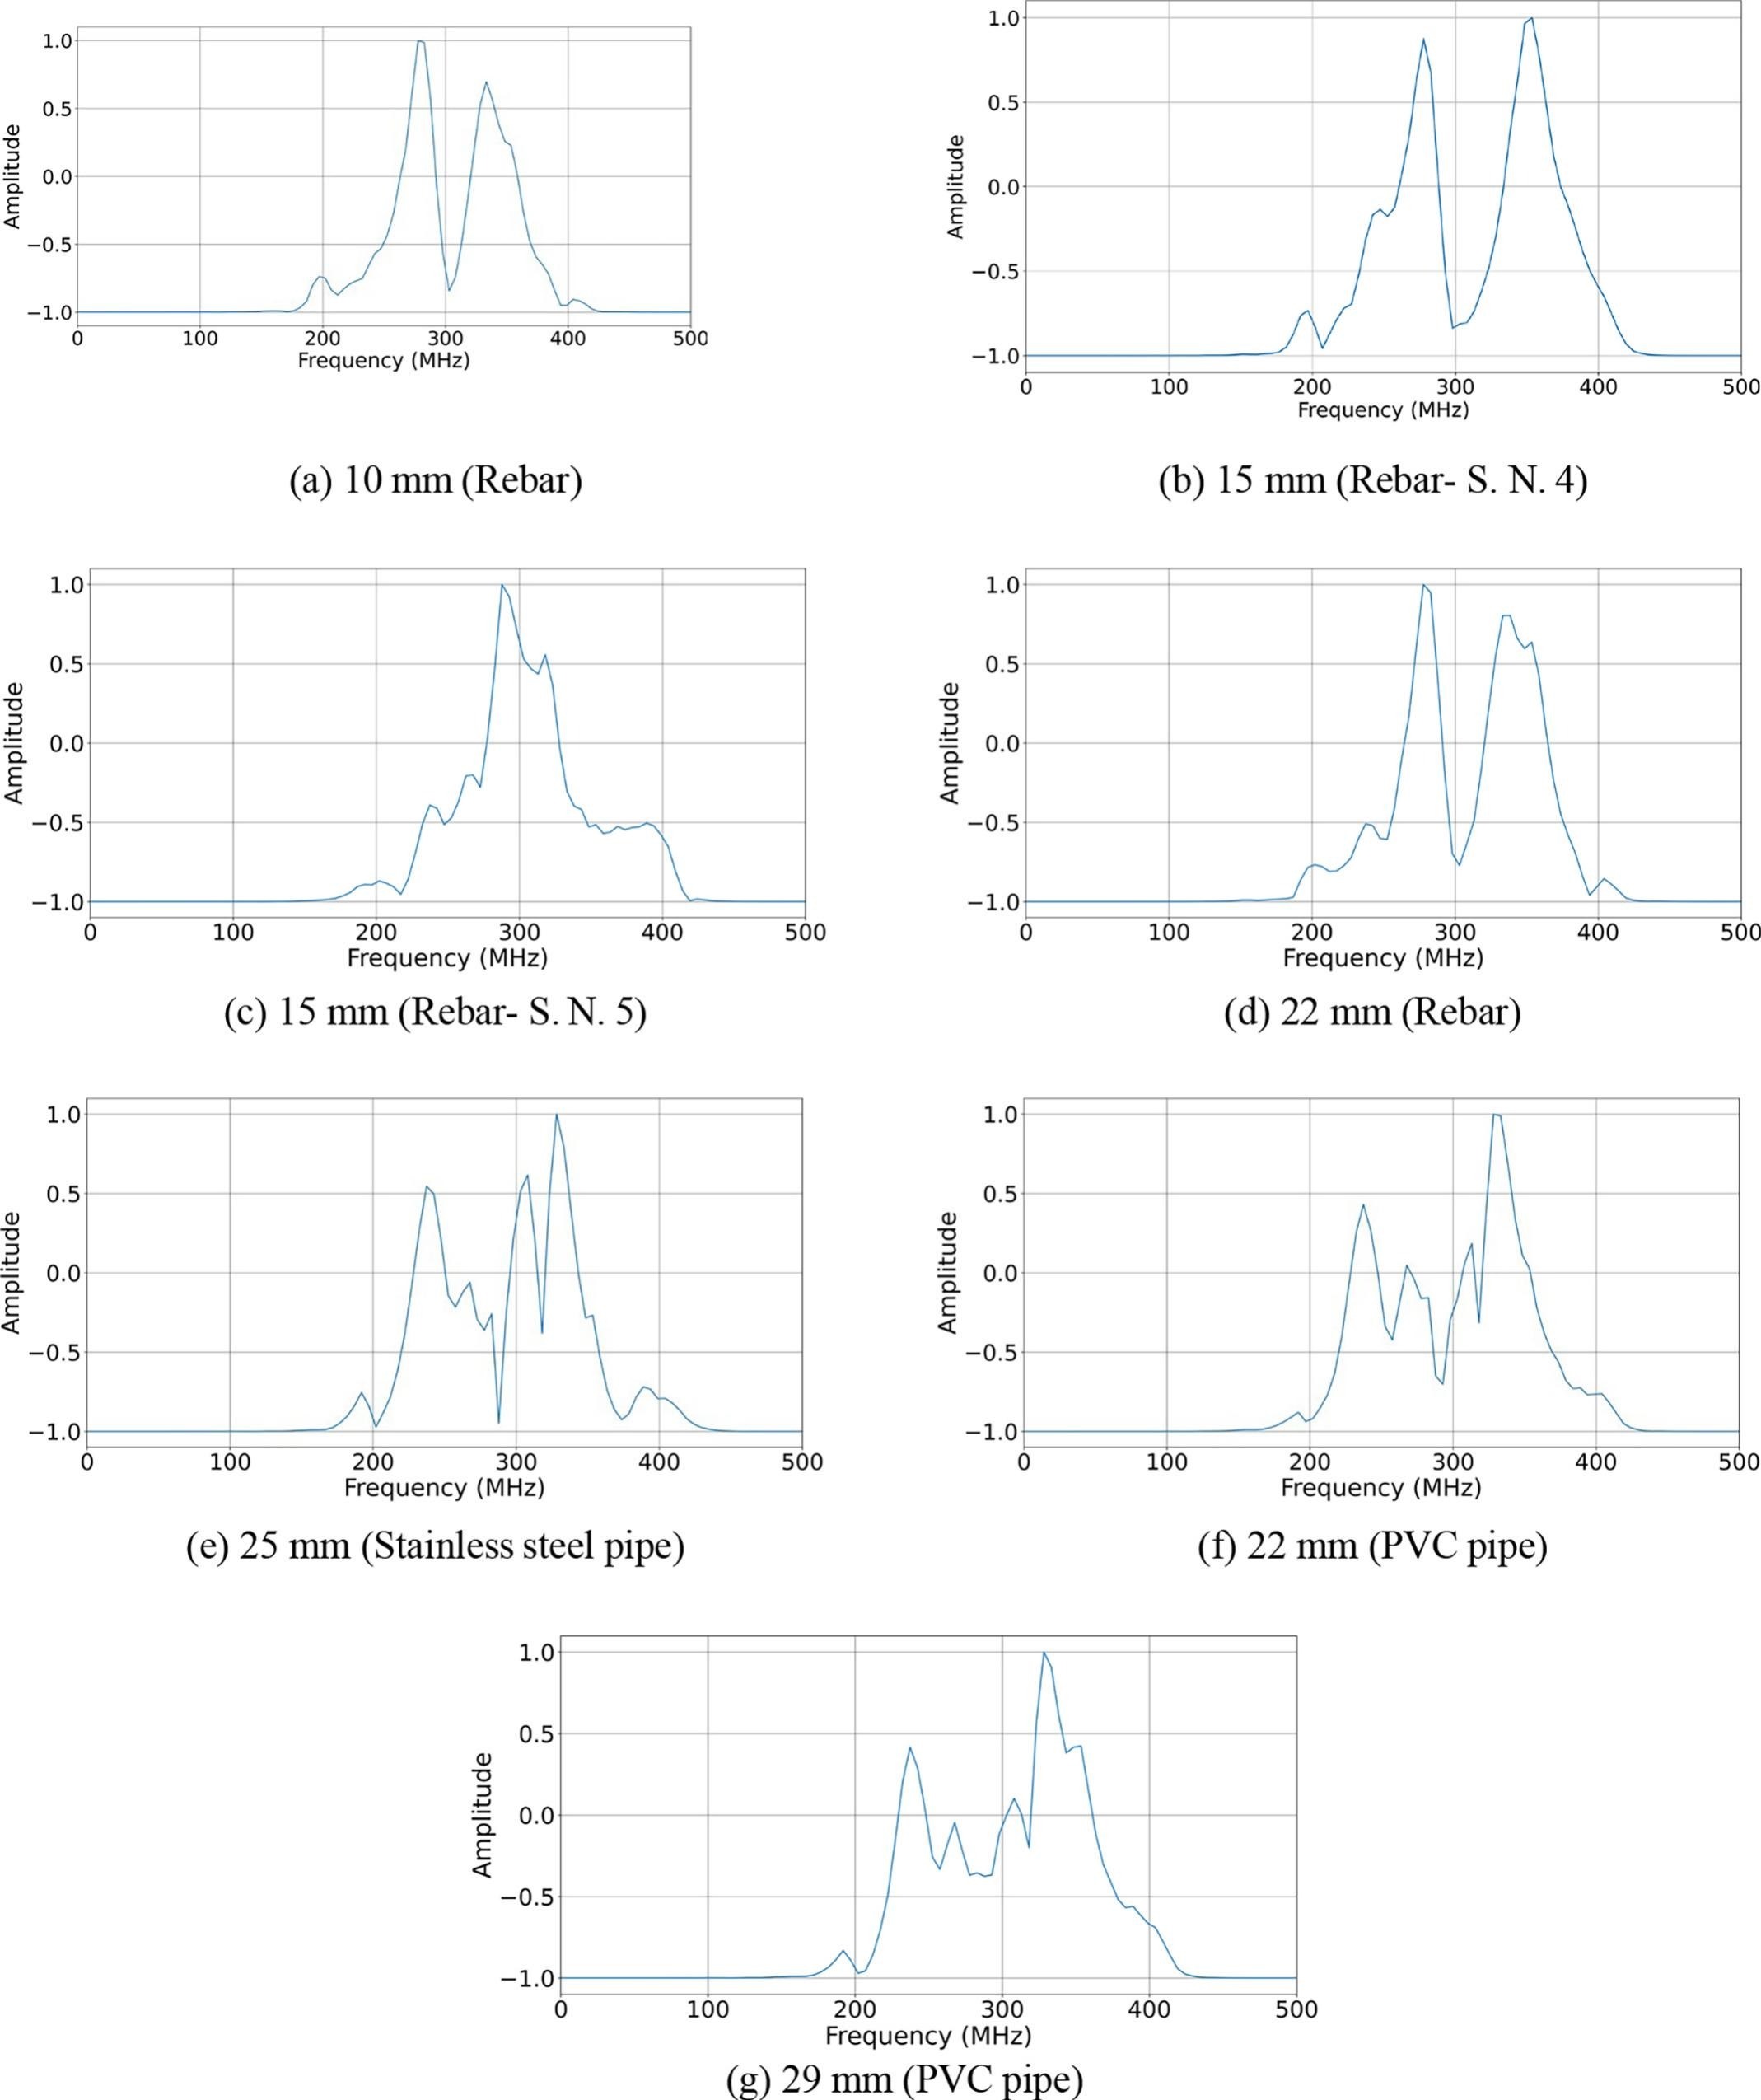
From the above figures, it is clear that there is a co-relation between the spectrum and the size of the buried objects, as was observed by other researchers [54][43][44][55]. However, it is seen that the spectra for the rebars of 15 mm (S. N. 4 and 5 in Table 1) are slightly different. This may be due to the difference in shape between the two. Very little or no difference in the spectra is seen for targets made of aluminium (S. N. 1 and 2) and PVC (S. N. 15 and 16) of different qualities. Data is collected using multiple targets of the same diameter value for data augmentation. This is to ensure that small changes in the object’s orientation do not affect the trained neural network model. Two separate datasets are created from the GPR data containing information in time domain (TD-dataset) and frequency domain (FD-dataset).
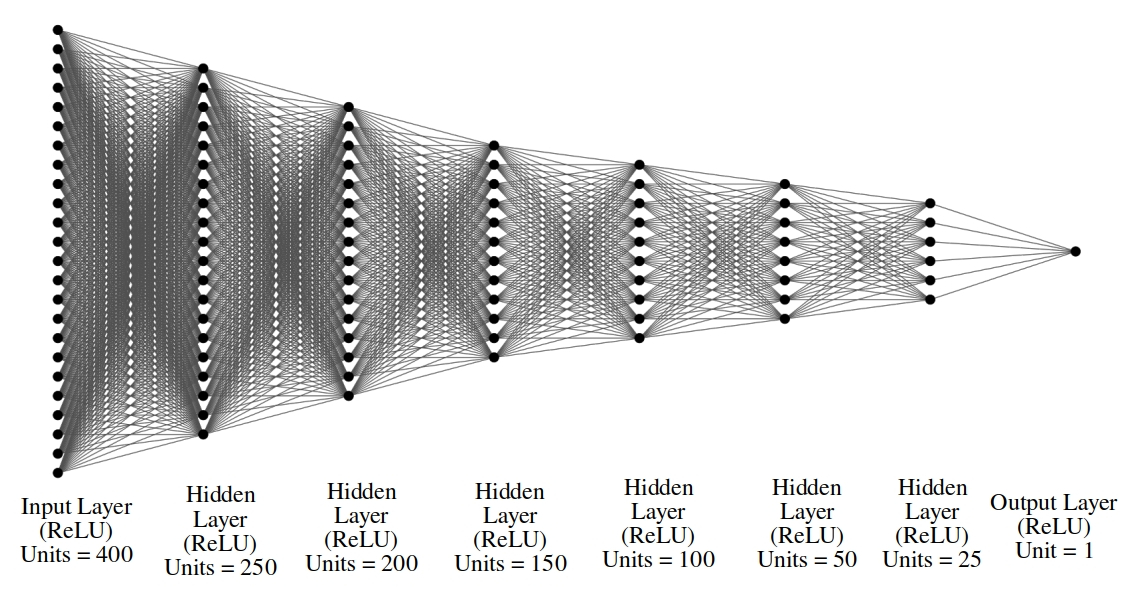
2.3. Proposed ANN architecture An ANN model is used in this study, where feature extraction occurs hierarchically. It is composed of several layers, each containing numerous neurons. Neurons in one layer are linked to every other neuron in the next layer. ANN comprises mainly forward and backward propagation. In forward propagation, each neuron is assigned weights and biases, as well as an activation function. The error between true and predicted values is calculated using a loss function. To determine the optimal hyper-parameters, backward propagation uses an optimisation function to minimise the loss in each successive iteration during training of the model. Out of a total of 1713 A-Scans, 1456 (85%) are used for training and 257 (15%) are used for validation of the model. The dataset is normalised before training the model. 2.3.1. Loss FunctionMean absolute percentage error (MAPE) is used as a loss function during training of the model. It is a measure of the absolute difference between the true and predicted values, and is expressed as a percentage. It is defined as the mean of absolute relative errors: \begin{equation} \label{eq8} MAPE = {\frac{1}{N}}\sum_{t=1}^{N}\left\lvert{\frac{P_t-A_t}{A_t}}\right\rvert \end{equation} where N is the no. of samples, ($P_t$) is the predicted value and ($A_t$) is the true value. 2.3.2. Evaluation MetricsMAPE is utilised as a metric to evaluate the training and validation of the ANN model. MAPE is a measure of a regression model’s performance that can be expressed in percentages, making it easily understood by anyone. 2.3.3. Final ArchitectureInitially, 200 neurons are used in the input layers and multiple hidden layers are added which have half the number of neurons than the previous layer. Performance is evaluated for different number of hidden layers. Same procedure is repeated for both the datasets containing GPR data in time domain and frequency domain. Table 2 shows the validation losses (MAPE) corresponding to different numbers of hidden layers for both datasets. From the table, it is clear that training the model on the dataset containing GPR spectrum information outperforms that one containing time domain data.| Sl. No. | No of Hidden Layers | Validation Loss (MAPE) | |
|---|---|---|---|
| Time Domain | Frequency Domain | ||
| 1 | 1 Layer | 15.63 | 8.17 |
| 2 | 2 Layers | 12.60 | 3.56 |
| 3 | 3 Layers | 9.84 | 2.61 |
| 4 | 4 Layers | 8.78 | 2.14 |
| 5 | 5 Layers | 8.46 | 2.42 |
| 6 | 6 Layers | 7.34 | 1.89 |
| 7 | 7 Layers | 6.72 | 2.08 |
| 8 | 8 Layers | 6.02 | 2.18 |
| 9 | 9 Layers | 5.67 | 2.28 |
| 10 | 10 Layers | 4.70 | 2.00 |
| (a) Predicted values | ||||
|---|---|---|---|---|
| Sl. No. | True values (mm) | Predicted values (mm) | Median (mm) | |
| Worst | Best | |||
| 1 | 10.0 | 10.84 | 9.99 | 9.99 |
| 2 | 15.0 | 14.17 | 15.00 | 14.97 |
| 3 | 18.0 | 18.70 | 17.98 | 18.11 |
| 4 | 22.0 | 14.77 | 22.05 | 22.10 |
| 5 | 25.0 | 26.81 | 25.05 | 25.05 |
| 6 | 29.0 | 24.40 | 29.00 | 28.83 |
| 7 | 30.0 | 31.06 | 30.02 | 29.94 |
| 8 | 35.0 | 36.86 | 35.03 | 34.88 |
| 9 | 41.0 | 41.96 | 41.04 | 41.04 |
| 10 | 38.0 | 39.43 | 37.95 | 37.95 |
| 11 | 50.0 | 46.82 | 50.04 | 49.86 |
| (b) Performance metrics | |
|---|---|
| Metrics | Value |
| MSE | 1.017 |
| MAE | 0.457 |
| MAPE | 1.887 |
| MSLE | 0.0017 |
| (a) Predicted values | ||||
|---|---|---|---|---|
| Sl. No. | True values (mm) | Predicted values (mm) | Median (mm) | |
| Worst | Best | |||
| 1 | 10.0 | 09.72 | 10.00 | 09.98 |
| 2 | 15.0 | 16.06 | 14.99 | 14.96 |
| 3 | 18.0 | 17.33 | 17.98 | 17.89 |
| 4 | 22.0 | 23.58 | 21.96 | 22.13 |
| 5 | 25.0 | 24.51 | 24.98 | 24.92 |
| 6 | 29.0 | 24.97 | 28.86 | 27.60 |
| 7 | 30.0 | 28.66 | 30.00 | 29.89 |
| 8 | 35.0 | 36.13 | 34.96 | 34.89 |
| 9 | 38.0 | 37.38 | 38.01 | 38.10 |
| 10 | 41.0 | 40.18 | 41.14 | 41.14 |
| 11 | 50.0 | 47.71 | 49.97 | 50.05 |
| (b) Performance metrics | |
|---|---|
| Metrics | Value |
| MSE | 0.565 |
| MAE | 0.383 |
| MAPE | 1.567 |
| MSLE | 0.001 |
| (a) Predicted values | ||||
|---|---|---|---|---|
| Sl. No. | True values (mm) | Predicted values (mm) | Median (mm) | |
| Worst | Best | |||
| 1 | 10.0 | 09.72 | 10.00 | 09.98 |
| 2 | 15.0 | 16.06 | 14.99 | 14.96 |
| 3 | 18.0 | 17.33 | 17.98 | 17.89 |
| 4 | 22.0 | 23.58 | 21.96 | 22.13 |
| 5 | 25.0 | 24.51 | 24.98 | 24.92 |
| 6 | 30.0 | 28.66 | 30.00 | 29.89 |
| 7 | 38.0 | 37.38 | 38.01 | 38.10 |
| 8 | 50.0 | 47.71 | 49.97 | 50.05 |
| (b) Performance metrics | |
|---|---|
| Metrics | Value |
| MSE | 0.149 |
| MAE | 0.234 |
| MAPE | 1.179 |
| MSLE | 0.0003 |
| (a) Predicted values | ||||
|---|---|---|---|---|
| Sl. No. | True values (mm) | Predicted values (mm) | Median (mm) | |
| Worst | Best | |||
| 1 | 29.0 | 24.97 | 28.86 | 27.6 |
| 2 | 35.0 | 36.13 | 34.96 | 34.89 |
| 3 | 41.0 | 40.18 | 41.14 | 41.14 |
| (b) Performance metrics | |
|---|---|
| Metrics | Value |
| MSE | 2.138 |
| MAE | 0.945 |
| MAPE | 3.032 |
| MSLE | 0.003 |
| Sl. No. | Author | Technique used | Application | Accuracy/Error |
|---|---|---|---|---|
| 1 | Rathod et al. (2019)[20] | GPR and Profoscope data | Rebar detection and diameter estimation | 2–11% error. 100% error for small diameters |
| 2 | Jazayeri et al. (2019)[19] | full-waveform inversion of GPR data | Reinforced concrete mapping and rebar diameter estimation | 11% error |
| 3 | Lei et al. (2020)[41] | Hyperbolic feature extraction CNN-LSTM Framework | Diameter identification of cylindrical objects in GPR B-Scans | 92.5% accuracy |
| 4 | Giannakis et al. (2021)[57] | Autoencoder as a pre processing step followed by ANN based regressor | Estimate the diameter of reinforcement bars in concrete | ±6 mm accuracy |
| 5 | Barkataki et al. (2022)[40] | Hyperbolic feature detection followed by deep CNN | Estimation of radius/ diameter of buried objects | 7% error |
| 6 | Present work | Feature extraction using ANN on spectral data of GPR A-Scans | Estimation of diameter of buried objects | 1.89% error |
References
- (2008): Ground penetrating radar theory and applications. elsevier, 2008.
- (2019): A new drone-borne GPR for soil moisture mapping. In: Remote Sensing of Environment, vol. 235, pp. 111456, 2019.
- (2021): Attenuation characteristics of ground penetrating radar electromagnetic wave in aeration zone. In: Earth Science Informatics, vol. 14, no. 1, pp. 259–266, 2021.
- (2021): Ground Penetrating Radar Survey of the Floor of the Accademia Gallery (Florence, Italy). In: Remote Sensing, vol. 13, no. 7, pp. 1273, 2021.
- (2004): Ground penetrating radar. The Institution of Electrical Engineers, 2004.
- (2014): Introduction to ground penetrating radar: inverse scattering and data processing. John Wiley & Sons, 2014.
- (2021): A review of GPR application on transport infrastructures: Troubleshooting and best practices. In: Remote Sensing, vol. 13, no. 4, pp. 672, 2021.
- (2019): Correlation between agrotechnical properties of selected soil types and corresponding GPR response. In: Acta Geophysica, vol. 67, no. 6, pp. 1913–1919, 2019.
- (2019): Ground penetrating radar use in flood prevention. In: Acta Geophysica, vol. 67, no. 6, pp. 1955–1965, 2019.
- (2015): Civil engineering applications of ground penetrating radar. Springer, 2015.
- (2021): GPR image interpretation advancement for smarter technical management of water leakage in urban water infrastructures. In: Earth Resources and Environmental Remote Sensing/GIS Applications XII, pp. 220–227, SPIE 2021.
- (2021): Frequency 3D slice image visualization for GPR applications. In: IOP Conference Series: Earth and Environmental Science, pp. 012019, IOP Publishing 2021.
- (2020): Semi-automatic detection of buried rebar in GPR data using a genetic algorithm. In: Automation in Construction, vol. 114, pp. 103186, 2020.
- (2022): GPR monitoring for road transport infrastructure: A systematic review and machine learning insights. In: Construction and Building Materials, vol. 324, pp. 126686, 2022.
- (2017): Pavement drainage pipe condition assessment by GPR image reconstruction using FDTD modeling. In: Construction and Building Materials, vol. 154, pp. 1283–1293, 2017.
- (2017): Determination of concrete rebars characteristics by enhanced post-processing of GPR scan raw data. In: NDT & E International, vol. 89, pp. 30–39, 2017.
- (2018): Investigation of reinforced concrete bridges by using a dual-polarized high-frequency GPR. In: 2018 17th International Conference on Ground Penetrating Radar (GPR), pp. 1–5, IEEE 2018.
- (2021): Compact Dual-Polarized Vivaldi Antenna with High Gain and High Polarization Purity for GPR Applications. In: Sensors, vol. 21, no. 2, pp. 503, 2021.
- (2019): Reinforced concrete mapping using full-waveform inversion of GPR data. In: Construction and Building Materials, vol. 229, pp. 117102, 2019.
- (2019): Applicability of GPR and a rebar detector to obtain rebar information of existing concrete structures. In: Case Studies in Construction Materials, vol. 11, pp. e00240, 2019.
- (2018): Simultaneous estimation of rebar diameter and cover thickness by a GPR-EMI dual sensor. In: Sensors, vol. 18, no. 9, pp. 2969, 2018.
- (2005): Application of radar technology to reinforced concrete structures: a case study. In: NDT & e International, vol. 38, no. 7, pp. 596–604, 2005.
- (2016): An experimental and numerical study on embedded rebar diameter in concrete using ground penetrating radar. In: Chin. J. Eng, vol. 2016, pp. 1–7, 2016.
- (2021): Removal of Clutter and Random Noise for GPR Images. In: 2021 IEEE 18th India Council International Conference (INDICON), pp. 1–6, IEEE 2021.
- (2021): A Novel Method of Hyperbola Recognition in Ground Penetrating Radar (GPR) B-Scan Image for Tree Roots Detection. In: Forests, vol. 12, no. 8, pp. 1019, 2021.
- (2019): Automatic hyperbola detection and fitting in GPR B-scan image. In: Automation in Construction, vol. 106, pp. 102839, 2019.
- (2013): Histograms of oriented gradients for landmine detection in ground-penetrating radar data. In: IEEE transactions on geoscience and remote sensing, vol. 52, no. 3, pp. 1539–1550, 2013.
- (2012): GPR-based landmine detection and identification using multiple features. In: International journal of antennas and propagation, vol. 2012, 2012.
- (2013): Interpretation of Ground Penetrating Radar (GPR) image for detecting and estimating buried pipes and cables. In: 2013 IEEE International Conference on Control System, Computing and Engineering, pp. 361–364, IEEE, 2013.
- (2015): Automated detection of reflection hyperbolas in complex GPR images with no a priori knowledge on the medium. In: IEEE Transactions on Geoscience and Remote Sensing, vol. 54, no. 1, pp. 580–596, 2015.
- (2018): An automatic GPR B-scan image interpreting model. In: IEEE Transactions on Geoscience and Remote Sensing, vol. 56, no. 6, pp. 3398–3412, 2018.
- (2020): Detection and localization of rebar in concrete by deep learning using ground penetrating radar. In: Automation in Construction, vol. 118, pp. 103279, 2020.
- (2000): Neural detection of pipe signatures in ground penetrating radar images. In: IEEE Transactions on Geoscience and Remote Sensing, vol. 38, no. 2, pp. 790–797, 2000.
- (2005): Location of steel reinforcement in concrete using ground penetrating radar and neural networks. In: Ndt & E International, vol. 38, no. 3, pp. 203–212, 2005.
- (2021): LSTM integrated with Boruta-random forest optimiser for soil moisture estimation under RCP4. 5 and RCP8. 5 global warming scenarios. In: Stochastic Environmental Research and Risk Assessment, pp. 1–31, 2021.
- (1998): A neural network approach to the interpretation of ground penetrating radar data. In: IGARSS'98. Sensing and Managing the Environment. 1998 IEEE International Geoscience and Remote Sensing. Symposium Proceedings.(Cat. No. 98CH36174), pp. 412–414, IEEE 1998.
- (2013): Buried object detection and analysis of GPR images: Using neural network and curve fitting. In: 2013 Annual International Conference on Emerging Research Areas and 2013 International Conference on Microelectronics, Communications and Renewable Energy, pp. 1–6, IEEE 2013.
- (2020): Machine learning methods applied in detection of buried targets for ground penetrating radar. In: IET International Radar Conference (IET IRC 2020), pp. 450–454, IET 2020.
- (2020): Advances of deep learning applications in ground-penetrating radar: A survey. In: Construction and Building Materials, vol. 258, pp. 120371, 2020.
- (2022): A CNN model for predicting size of buried objects from GPR B-Scans. In: Journal of Applied Geophysics, vol. 200, pp. 104620, 2022, ISSN: 0926-9851.
- (2020): Underground cylindrical objects detection and diameter identification in GPR B-scans via the CNN-LSTM framework. In: Electronics, vol. 9, no. 11, pp. 1804, 2020.
- (2005): Non-destructive evaluation of concrete moisture by GPR: experimental study and direct modeling. In: Materials and structures, vol. 38, no. 9, pp. 827–832, 2005.
- (2015): Evaluation of the GPR frequency spectra in asphalt pavement assessment. In: Construction and Building Materials, vol. 96, pp. 181–188, 2015.
- (2018): GPR clutter amplitude processing to detect shallow geological targets. In: Remote Sensing, vol. 10, no. 1, pp. 88, 2018.
- (2011): Chlorides and moisture assessment in concrete by GPR full waveform inversion. In: Near Surface Geophysics, vol. 9, no. 3, pp. 277–286, 2011.
- (2012): GPR full-waveform inversion of chloride gradients in concrete. In: 2012 14th International Conference on Ground Penetrating Radar (GPR), pp. 320–323, IEEE 2012.
- (2013): Measurement of accelerated steel corrosion in concrete using ground-penetrating radar and a modified half-cell potential method. In: Journal of Infrastructure Systems, vol. 19, no. 2, pp. 205–220, 2013.
- (2016): An experimental study for quantitative estimation of rebar corrosion in concrete using ground penetrating radar. In: Journal of Engineering, vol. 2016, 2016.
- (2018): Clutter elimination and random-noise denoising of GPR signals using an SVD method based on the Hankel matrix in the local frequency domain. In: Sensors, vol. 18, no. 10, pp. 3422, 2018.
- (2021): Frequency based signal processing technique for pulse modulation ground penetrating radar system. In: International Journal of Electrical and Computer Engineering, vol. 11, no. 5, pp. 4104, 2021.
- (2021): Improvement of gpr-based rebar diameter estimation using yolo-v3. In: Remote Sensing, vol. 13, no. 10, pp. 2011, 2021.
- (2022): Nondestructive detection of cavities beneath concrete plates using ground penetrating radar and microphone. In: NDT & E International, pp. 102663, 2022.
- (2021): Design of a 400 MHz Cavity Backed CPW Fed Bow-Tie Antenna for GPR Applications. In: 2021 International Conference on Industrial Electronics Research and Applications (ICIERA), IEEE 2021.
- (2014): Spectral analysis of ground penetrating radar signals in concrete, metallic and plastic targets. In: Journal of Applied Geophysics, vol. 100, pp. 32–43, 2014.
- (2019): Ground-penetrating radar for the evaluation and monitoring of transport infrastructures. In: Innovation in Near-Surface Geophysics, pp. 341–398, Elsevier, 2019.
- (2010): Effects of antenna-target polarization and target-medium dielectric contrast on GPR signal from non-metal pipes using FDTD simulation. In: NDT & E International, vol. 43, no. 5, pp. 403–408, 2010.
- (2020): A machine learning scheme for estimating the diameter of reinforcing bars using ground penetrating radar. In: IEEE Geoscience and Remote Sensing Letters, 2020.